
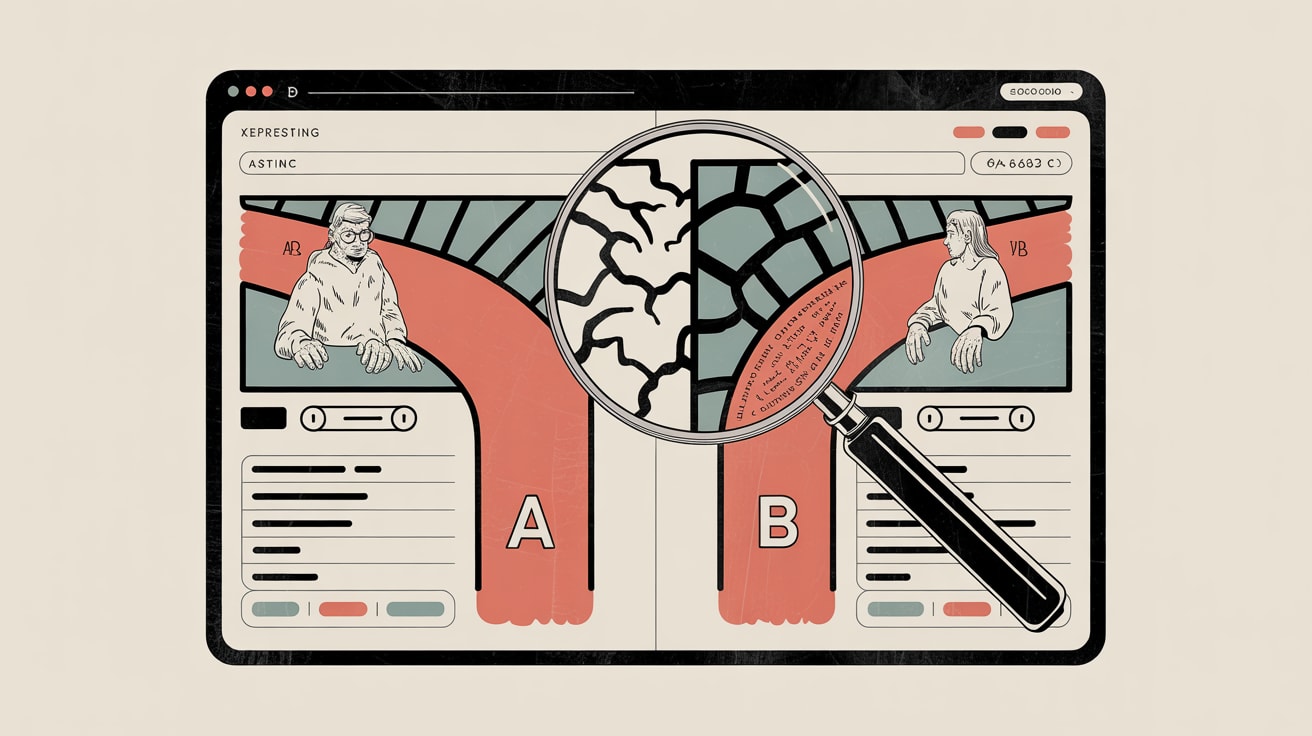
Most A/B tests produce misleading results due to four fixable statistical errors. Here's how to redesign your testing pipeline for decisions you can trust.
Most marketing teams have a quiet confidence in their A/B test results. They shouldn’t. According to Towards Data Science contributor Kaushik Rajan, four systematic statistical errors invalidate the majority of A/B tests run in production environments — and the consequences aren’t just academic. When your A/B testing pipeline is structurally broken, every optimisation decision built on top of it is built on sand.
For data teams in SEA, where campaign cycles are compressed, budgets are contested, and a single Shopee or Lazada mega-sale can skew months of baseline data in 48 hours, the cost of a lying test isn’t a footnote — it’s a misdirected budget.
The Four Statistical Sins Killing Your A/B Test Validity
Rajan identifies four recurring failure modes that corrupt A/B test results before anyone even looks at a dashboard. The first is peeking — stopping a test early because results look promising. This inflates false positive rates dramatically; the statistical threshold you set at the start assumes you’ll check results exactly once. Every additional peek compounds Type I error.
The second is underpowering — launching tests without calculating the sample size needed to detect a meaningful effect. A test with 60% statistical power has a 40% chance of missing a real improvement entirely. The third is multiple comparisons without correction — testing five variants simultaneously and treating each at a 95% confidence threshold means your actual experiment-wide false positive rate is closer to 23%. The fourth is Simpson’s Paradox blindness — failing to segment results by cohort, which can make a feature look like a net win when it’s actively harming your highest-value user group.
None of these are exotic edge cases. They’re the default behaviour of teams that inherited their testing setup rather than designed it.
Building a Pre-Test Checklist Into Your Pipeline
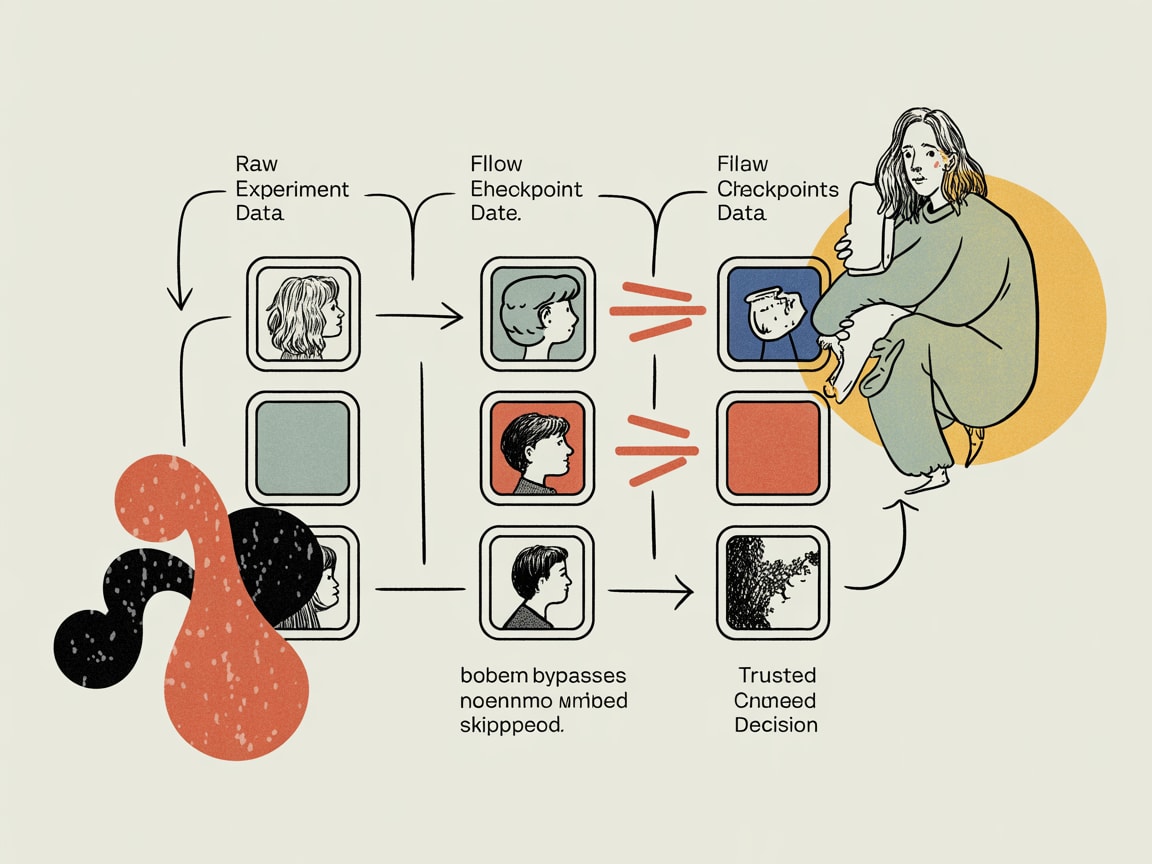
The fix isn’t more statistical literacy across the organisation — that’s a long game. The fix is encoding rigour into the infrastructure so that tests that don’t meet baseline quality standards can’t ship.
A pre-test checklist should gate experiment creation, not just inform it. At minimum, this means automated sample size calculation based on declared minimum detectable effect (MDE) and current baseline conversion rate, mandatory test duration locked before launch, and a segment specification step that forces teams to define primary and secondary cohorts upfront.
For SEA deployments specifically, this matters beyond methodology. Mobile-first markets like Indonesia and Vietnam exhibit dramatically different conversion behaviour across device types and network conditions. A test that doesn’t pre-stratify by device class is likely measuring a confound, not a feature effect. Build that stratification into the pipeline schema — not as an optional filter analysts can apply post-hoc, but as a required dimension at experiment registration.
Frequentist vs. Bayesian: It’s an Infrastructure Decision, Not a Philosophy Debate
Most teams default to frequentist testing because their tooling does. Google Optimize, Optimizely, and most homegrown solutions return p-values and confidence intervals — the grammar of frequentist statistics. But Rajan’s framework makes a compelling case that Bayesian approaches are better suited to the operational realities most growth teams actually face.
Frequentist methods answer: if there were no real effect, how surprising would this data be? Bayesian methods answer: given this data, how probable is it that variant B is better, and by how much? For a marketing director asking whether to roll out a new checkout flow across Grab’s merchant platform, the second question is the one that drives the meeting.
Bayesian testing also handles the peeking problem more gracefully. Because it updates probability estimates continuously rather than testing against a fixed threshold, you can monitor results in real time without inflating false positive rates — which is operationally critical during high-velocity periods like Harbolnas or 11.11.
The infrastructure implication: if you’re building or rebuilding your experimentation layer, evaluate whether your data warehouse can support the sequential likelihood ratio calculations that Bayesian engines require. dbt-compatible experimentation frameworks like GrowthBook now offer Bayesian modes that sit cleanly on top of BigQuery or Snowflake — the heavy lifting is in the pipeline design, not the statistics.
Segmentation Depth: Where Spectral Clustering Earns Its Place
There’s a quieter problem underneath the test validity question: most A/B tests are run on user populations that were never properly characterised in the first place. Teams split traffic 50/50 on a user base that contains meaningfully different behavioural clusters — and then wonder why results don’t replicate across markets.
This is where advances in clustering methodology become practically relevant. Rukshan Pramoditha’s analysis of spectral clustering in Towards Data Science illustrates why K-means — the default in most marketing analytics stacks — struggles with non-convex cluster shapes. Spectral clustering uses eigenvector decomposition of a similarity graph to identify clusters based on connectivity rather than geometric proximity. In plain terms: it finds groups of users who behave similarly even when they don’t look similar on surface-level dimensions like demographics.
For SEA markets, where a “Thai mobile user” can represent wildly different purchase behaviours depending on platform preference, payment method, and social commerce exposure, building richer pre-segmentation into your user taxonomy before running experiments dramatically improves result interpretability. The pipeline investment — running spectral clustering periodically on behavioural event data and writing cluster labels back to your user dimension table — pays off in test designs that are structurally less likely to mask heterogeneous treatment effects.
Key Takeaways
- Gate experiments at creation, not analysis — automate sample size calculation, test duration, and segment specification as mandatory fields in your experiment registry, not optional analyst tasks.
- Evaluate Bayesian testing frameworks for high-velocity campaign environments — tools like GrowthBook on BigQuery or Snowflake offer real-time monitoring without the false positive inflation that sinks frequentist tests under operational pressure.
- Run periodic behavioural segmentation and write cluster labels back to your user dimension table — richer pre-segmentation makes A/B test populations more homogeneous and results more reliable across SEA’s diverse market conditions.
The uncomfortable truth is that most experimentation programmes are producing a body of evidence that can’t be trusted — not because the teams are careless, but because the infrastructure wasn’t designed with statistical validity as a first-class concern. The question worth sitting with: if you audited every product and campaign decision made in the last 12 months that was justified by an A/B test, how many of those decisions would survive scrutiny?
Sources

Written by
Chunky GrizzlyDesigning the foundational plumbing — data warehouses, lakehouse models, and ETL pipelines — that separates organisations with genuine intelligence from those drowning in dashboards.